Note: The Sumo app referenced inside this blog post has now been deprecated.
To learn about Sumo’s new apps for growing your business, click here to visit the Sumo home page.
I think you’ll agree there is one HUGE problem with trying to apply advice from others to your website: their site is completely different from yours.
You have a different target audience, a unique product, a one-of-a-kind offering, and don’t share their problems. There are definite principles that heat map analysis teach and you can take some of that advice, apply it and grow your site–but a cookie cutter approach isn’t the answer.
Today, I’ll show you how to run a heat map analysis using a tool that provides actionable data specifically about how your visitors use your site.
Heat Maps show you the most strategic opportunities on YOUR site…not someone else’s.
Don't worry. We're going to give you the 5 steps to set up your own Heat Maps and get the most out of them. We'll also show you real world case studies so you can see how to use heatmap data to improve conversions. The case studies shown feature 1,000,000+ clicks from visitors.
What is a Heat Map (& Why Does It Matter)
With Heat Maps, you’ll see exactly how visitors use your site. Instead of guessing, you'll know exactly how to transform the design, flow and layout of your website to make visitors (and your bottom line) happy. Heat Map tracking allows you to visualize data that Google Analytics can't give you. Within a week you'll get super actionable information that you can use to generate more leads and sales from your site.
Heat Maps will show you:
- If your visitors are distracted by too many choices
- How to improve conversions
- How to get more email subscribers
- What to emphasize, repurpose, and remove from your pages
- Which images to reuse for ads, sales pages, and emails
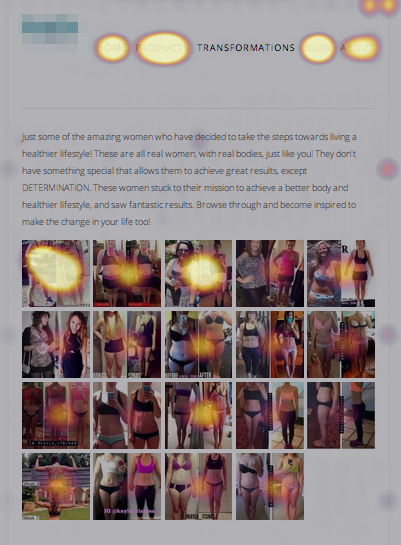
Case Study: How Lindsey Martin Used Heatmaps to Find High-Converting Images
Lindsey Martin, a marketing consultant, uses Heat Maps on her clients’ testimonial pages to see which images worked best. Here's what Lindsey had to say:
"Heat Maps allow us to see which images people are the most intrigued by. We can then highlight these images for our advertising, or in any featured blogs, as well as look for similar images to highlight in the future."
Heatmap data can sidestep questions about what images to use on your important landing pages. Below is an example of one testimonial page heat map:
Here are 5 Steps that will help you create a successful heat map campaign and improve your website.
Step #1: Pick Your First Page To Test
Don’t test everything right away — that will lead to analysis by paralysis. Instead, focus on one or two of your most important pages to set up a heat map campaign. If you have a blog, focus on your homepage. If you have an ecommerce store, set up a heat map on your best selling product’s page.
Here is a comprehensive list of the pages you may want to test:
- Homepage
- Product pages
- Link pages
- Landing pages
- Resource pages
- FAQ Page
- Portfolio pages
- Popular blog posts
- Testimonial/What Others Are Saying pages
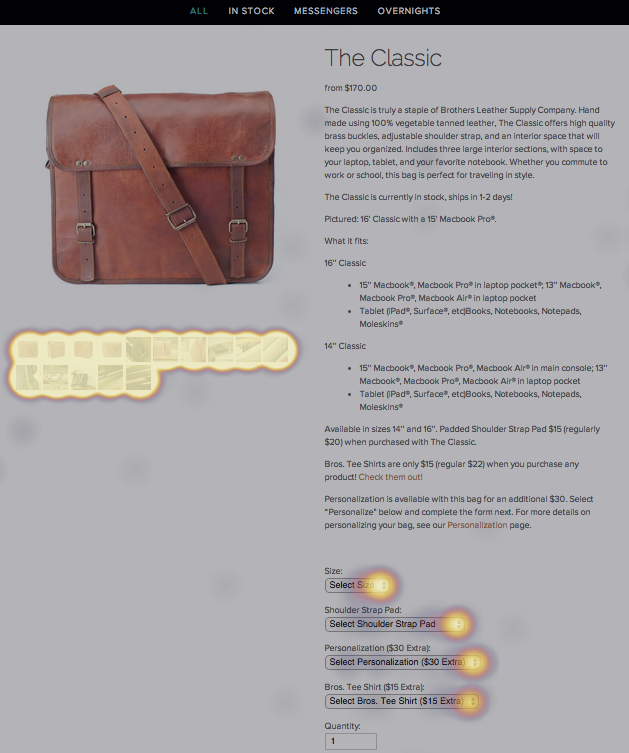
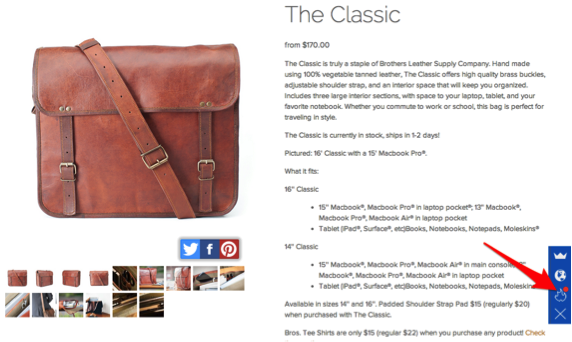
Case Study: How Bros Leather Supply Co Selects Pages to Test
A great example of picking the right pages to test comes from Bros Leather Supply Co. They selectively picked their homepage, store page, and their top two product pages. Improving conversion on these pages can have a large impact on the sales and bottom line. Below is a look at the heat map of their top selling product "The Classic" bag. It’s obvious that users love the images and want to see what options (size, shoulder strap pad, personalization) they can choose.
Founder Adam Kail writes, "Heat Maps have reinforced our need for great images on all of our product pages. We used to slave away over the right copy– but now we spend time getting images just right. Each image shows a different use or angle for our bags… Future customers want to know how the bag looks with a laptop inside, when it’s full, when someone is wearing it."
Step #2: Picking an Objective
Your first step is to choose a goal for each page. Let’s use your homepage as an example. What is the #1 thing you want every visitor to do on your homepage?
Examples of your #1 thing might be:
- Sign up to an email list
- Download an App
- Schedule a meeting
- Read and share the latest blog post
- Install your plugin / software / tool
- Subscribe to a trial period
Write your goal down on a piece of paper. If you are setting up heat maps on multiple pages, pick an objective for each page. You probably want to start off with one page until you get the hang of it.
Case Study: The Sumo Homepage – Defining One Objective
Let’s look at the Sumo homepage and what the heat map shows us. Our #1 goal for the page is to get visitors to install the Sumo plugin or code.
Take a look at the heatmap below and you’ll notice a few things:
- The "About" page link gets a lot of clicks
- Visitors tend to click on "Get Started" and "Watch Video" the most
- People are clicking the down arrow (even though it doesn't do anything)
- The individual tools get a lot of clicks, but the tools on the right side of the page get fewer clicks
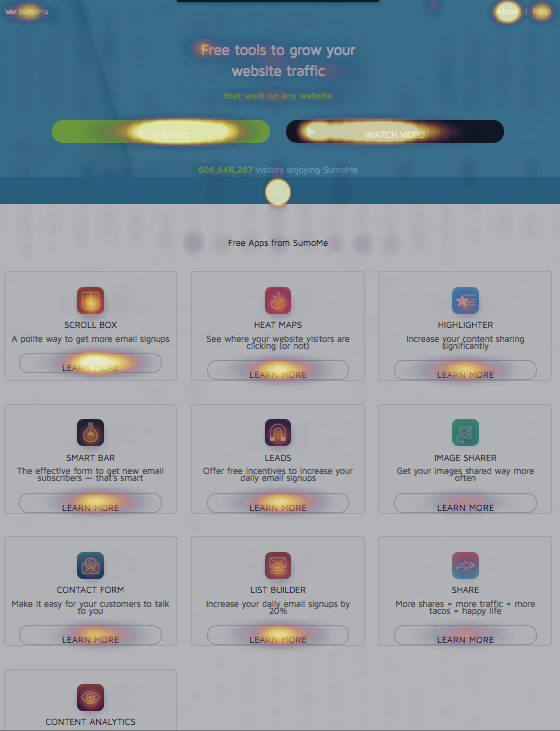
This shows us that we may want to:
- Test moving the "About" link to the bottom of the page
- Keep the Watch Video updated and find ways to improve it
- Make the down arrow jump the user down the page
- Test moving tools to the left to see if they get additional clicks
Step #3: Questions to Ask Before Setting Up Your Heat Map
To set up your heat map skip to step #4 below. To maximize the benefits your heat map, review these 10 questions. The questions will help guide you before and after the data comes in.
10 Questions to Ask Yourself Before Starting a New Heat Map:
- What’s the #1 objective of this page?
- In a perfect world, where would my visitors click?
- In a worst-case scenario, where would my visitors click?
- If I could have them click on one thing what would that be?
- What do I think is most convincing on the page: buttons, images, or text?
- What do I do if people aren’t clicking where I want them to click?
- What distractions are on the page? What gets in the way of my objective?
- How do I guide them on the path I want them to be on?
- If no one is clicking, am I prepared to remove or change the page?
- How can I continue using a heat map to show me if future changes are effective?
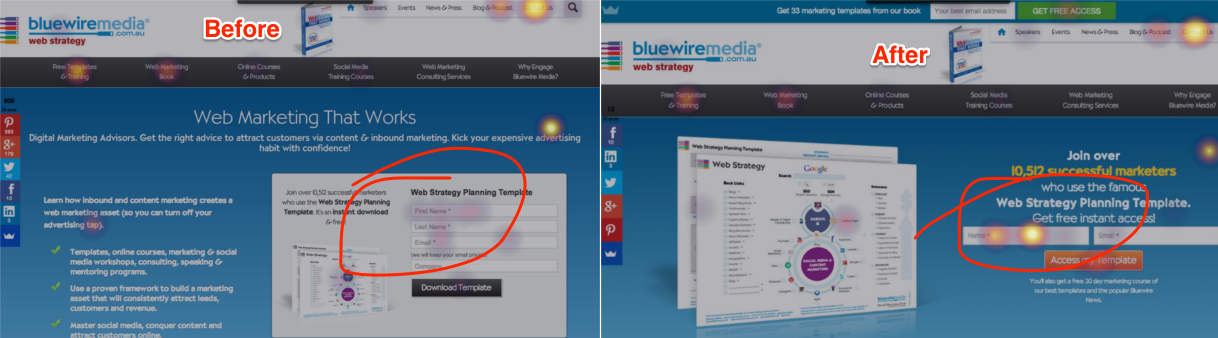
Case Study: How Bluewire Media Used Questions to Guide Maximize a Heat Map
Adam Franklin at Bluewire Media in Australia, a web strategy company, wanted to find a way to make their home page more effective. He began by asking, "What is the #1 objective of our homepage?" and "What gets in the way of our objective?" His primary goal for the homepage was to have first time visitors sign up to join their email list and get a free Web Strategy Planning Template. He began by walking through a series of questions, asking about distractions and ways simplify the email sign up form. Heat Maps showed him that their layout and forms limited the number of email sign ups.
"Our Heat Map has highlighted some massive mistakes I was making and could easily fix. No-one was seeing the opt-in form on the homepage, nor the form on some of my landing pages. These are redesigned now and the Heatmap (and analytics) is proving the change is working. Now we are testing a new version without a menu bar on the page."
Step #4: Set Up Your First Heat Map
There are a number of free and paid Heat Map tools you can use on your website. Using the steps below, you can set up Heat Maps by Sumo in fewer than 5 minutes — it works on all websites and offers a special plugin for WordPress sites.
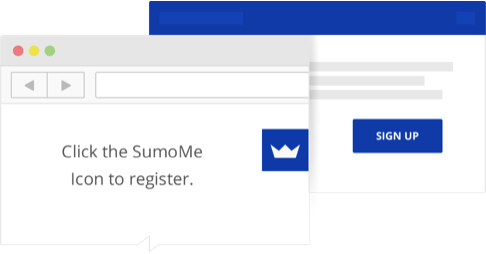
A) Install Sumo by following the instructions here for HTML or WordPress
- Register a Free Account
- Click on the Sumo badge in the top right of your site. Sign up to register your account.
- Click the badge again to get to your apps. Click on the green Sumo Store logo.
- Scroll down to Analytics and click Heat Maps.
- Click Install to add Heat Maps to your site
B) Start a Heat Map Campaign
- Click on the Sumo badge and you’ll see an "Flame" icon.
- Click the blue flame icon to begin a new campaign. A message will pop up asking if you want to start recording click "Yes."
- Now the campaign is active.
C) Viewing the Heat Map Results
To view the Heat Maps click return to the page and click the "Flame" icon again. Or you can access Heat Maps from the Sumo Dashboard.
Step #5: Use Your Heat Map to Get More conversions
Heat Maps give you awesome information about how people interact with your site. But the real work begins when you start to apply this information into your A/B testing.
Pro Tip: Run your heat map for at least one week. (If your site receives fewer than 10,000 visits a month, allow your heat map to run for 3 to 4 weeks.) Now it’s time to look at the Heat Map to make the information as valuable as possible. That way, you can transform the design, flow, and layout of your website for better results.
Questions to ask for analysis:
- Is my #1 objective the most clicked / hottest spot?
- What 3 areas are being the most clicked?
- What hot spots were unexpected?
- What type of medium received the most clicks (images, video, text, buttons)?
- Which images received more clicks than others on the same page?
Taking action:
- How can I repurpose the hot spots to achieve my #1 objective?
- What hot spots / links can I remove that distract from my objective?
- How can I add more of the content (images/video/text) that my audience engages with?
Now, what should you do with the heat map information after you’ve let it run and analyzed it?
Begin by making small changes that are within immediate reach. For example, remove underperforming images and links in the sidebar.
While the data from your new Heat Map may seem obvious, it can help you see what needs to change. The most powerful way to use a Heat Map is to use an existing "hot spot" on your heat map to achieve your objective. If an area is already receiving a high number of clicks, leverage it to point to the content or action you want your visitor to take.
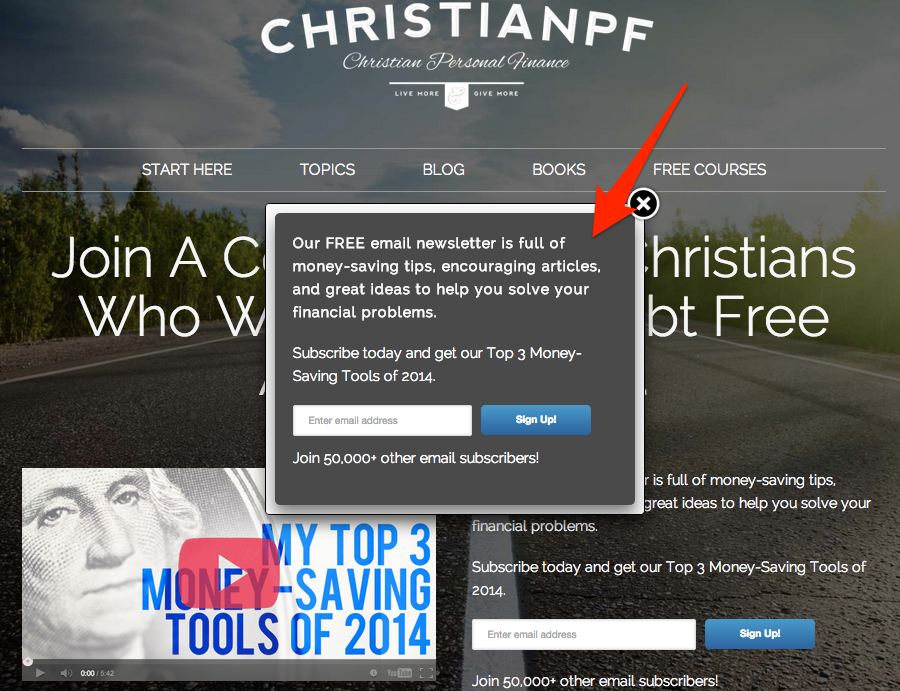
Case Study: How ChristianPF.com Optimized High Click Assets
Bob Lotich, a personal finance blogger at ChristianPF.com, used Heat Maps to discover that the video on his homepage was receiving thousands of clicks — but only a handful of those visitors were subscribing to his email list. Here's what Bob had to say:
"I discovered a silly mistake I had made with the video on my homepage and I would have never known about it otherwise. People were clicking the video graphic like crazy; after all it does have a big fat play button on it! I quickly had my developer add a popup box so that when they clicked on the graphic they opted-in to see the video."
"The change doubled the number of email subscribers I get from my homepage.You just need to use heat maps to learn what you don't know or you haven’t fully realized."
Drawing Conclusions
To summarize, here are some data-driven insights we’ve learned from millions of heat map clicks that you should be aware of as you set up your heat maps, analyze the data, and optimize:
- Menu Bars are distracting; remove them from a homepage and landing pages
- Images receive the most clicks
- Sidebars generally are ignored
- Call to Actions work better above AND below the fold (use both)
- Remove any unnecessary fields to capture more emails
Click here for your own heat maps optimization spreadsheet!
And then click here to start optimizing your site and your conversions with Heat Maps


Add A Comment
VIEW THE COMMENTS