Social Sharing Best Practices To Grow Your Website Traffic

Last Updated Apr 12, 2019
Last Updated Apr 12, 2019
Did you know you’re twice as likely to share something to Pinterest on desktop rather than mobile?
Or how about that feeling when you realize people really don’t share your content to LinkedIn?
I didn’t, either. But then I analyzed 200,000,000 social shares from our Share app and came to a surprising revelation:
The social sharing trends you’ve heard aren’t actually best practices.
But maybe you don’t put too much stock into social sharing. If that’s the case, consider this:
Social shares bring new traffic: You have a set amount of people you market to. Social sharing widens that net and brings new people in.
Sharing is free brand awareness: Sharing provides a network effect -- readers share to people outside of your normal audience. That increases your overall brand reach.
Social shares give your content credibility: The more visible shares your content has, the higher the odds a visitor will read your content (and therefore share it).
This is the cheapest form of marketing because it’s free. You already created the content. Now you make it work even harder for you (without you lifting a finger).
If you weren’t paying attention to social sharing before, then consider this guide your wakeup call.
If you have been paying attention but you want more shares for your content, then consider this an eye-opener.
Click here to download the entire list of 70 places people share content to.
The stuff we’ll go over will help you understand everything from when shares occur to where your audience shares the most content:
Let’s dig into some sweet, delicious data, shall we?
Social sharing has a “best of times, worst of times” pattern. There’s a definitive pattern that reveals when you’re most likely to get shares (and when you’ll be begging for them):

We pulled data from May because it’s the most consistent month of the year. There are no holidays, Black Friday-esque days or anything else that can disproportionately influence traffic to a site.
You’ll notice a couple things:
Weekends are a bad time for shares: Social shares dip dramatically on Saturday and Sunday. Your shares decrease at least 17% just on the weekend. People are out doing stuff. Leave them alone.
Beginning of weeks rake in shares: Mondays and Tuesdays see the most shares, with Wednesday signaling the start of a decrease in shares. People are energized for the week, ready to kick butt and share!
So what does that mean for you?
If you’re looking for the most shares possible, you’ll want your content ready to roll by Monday. Then you get to ride the share wave from Monday to Wednesday.
Your content will get shares throughout its lifecycle, but content has the best chance for shares when the most amount of traffic occurs.
That’s within the first few days of publishing.
Scratch that. It’s not just about publishing the content and waiting for the shares. The reason you’d want to publish Sunday (afternoon or night) is so you’ll be ready to promote right away Monday morning.
In our “30 Writing Tips for Bloggers” guide, we talked about the importance of having a plan for traffic. So it’s the promotion of your content Monday-Wednesday that matters most on launch.
But where do those shares go throughout the week? Where do readers like to distribute your excellent content?
Let’s find out.
You know Facebook, Twitter, Pinterest and LinkedIn.
But do youuuu recalllll...Tumblr? Or Digg? Or even Pocket?
Of the 200 million shares in the past year and a half, there were over 70 different mediums shared to.
NOTE: If you’re curious what all 70 of those mediums are and how many people share to each of them, click here to download the spreadsheet. I only cover the 13 biggest mediums in this guide.
Seventy is a lot.
But really there are 13 main social platforms readers share content on:
Throughout the year, each of these mediums accounted for at least 50,000 shares. The funny thing is, no one medium was ever truly dominant.
Except Facebook. Facebook reigns supreme in the share game.
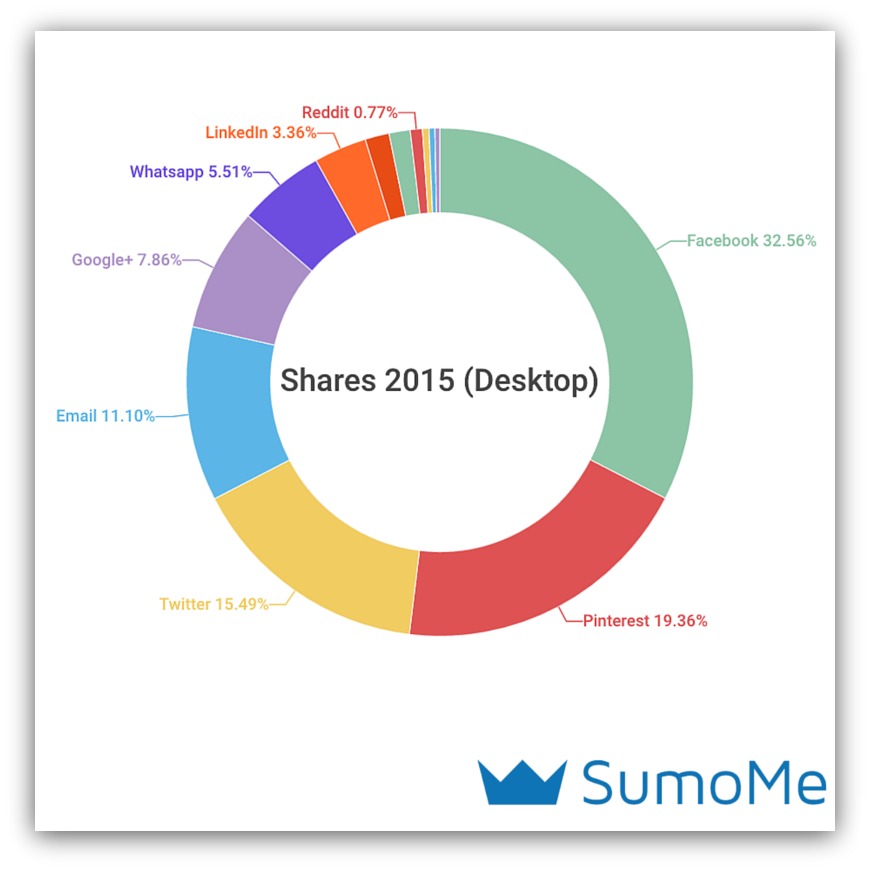
Let’s start with a history lesson. Here’s what the State of Shares™ looked like in 2015:
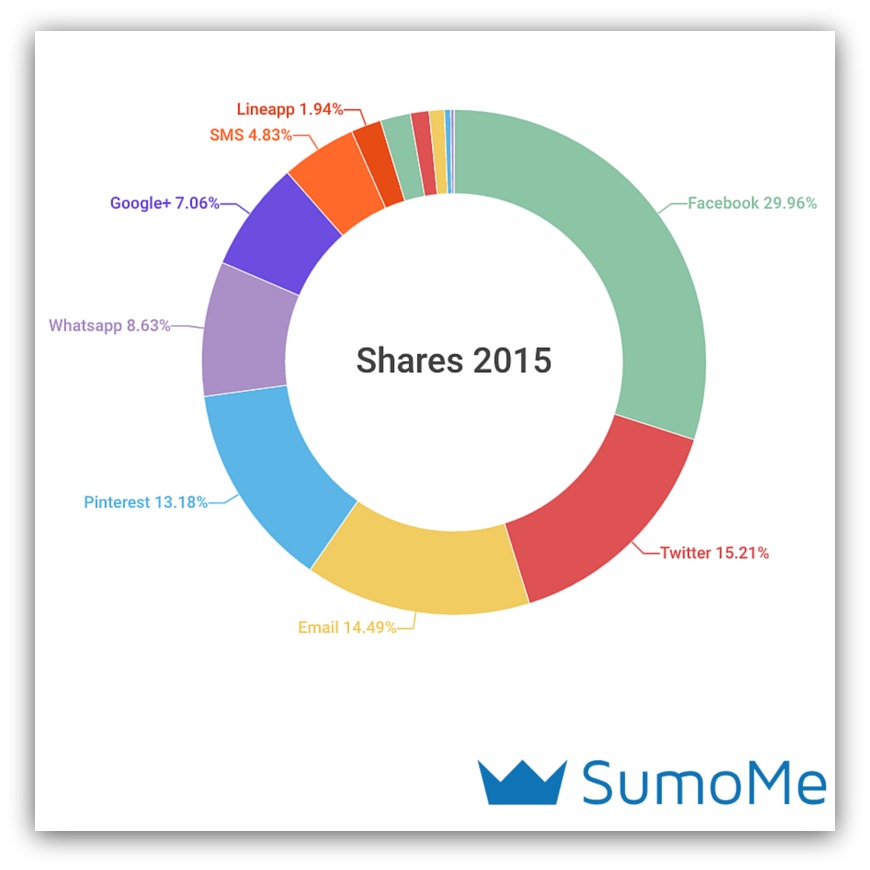
Not Pictured (Under 1.5%): LinkedIn, Reddit, Stumbleupon, Buffer, Pocket
This graph breaks down the percent of shares from the 13 most shared-upon mediums. Facebook literally crushes everyone else, almost doubling up the next closest medium (Twitter).
That makes Facebook a prime target for shares, with almost 30% of readers sharing to it. Twitter, Email and Pinterest all sit above the 10% mark, with Whatsapp, Google+, SMS and Lineapp all following.
(Quick Note: WhatsApp and Lineapp are both cellular-based services that act as a substitute for text messaging. They’re commonly used in the Asian and South American markets.)
So in 2015, Facebook, Twitter and Pinterest were shared to most, with a healthy amount of readers sharing content via email.
But then 2016 rolled around…
...and not much changed.
Ok. Some things changed. But it’s more about the overall pattern than the shift in the share leaderboard:
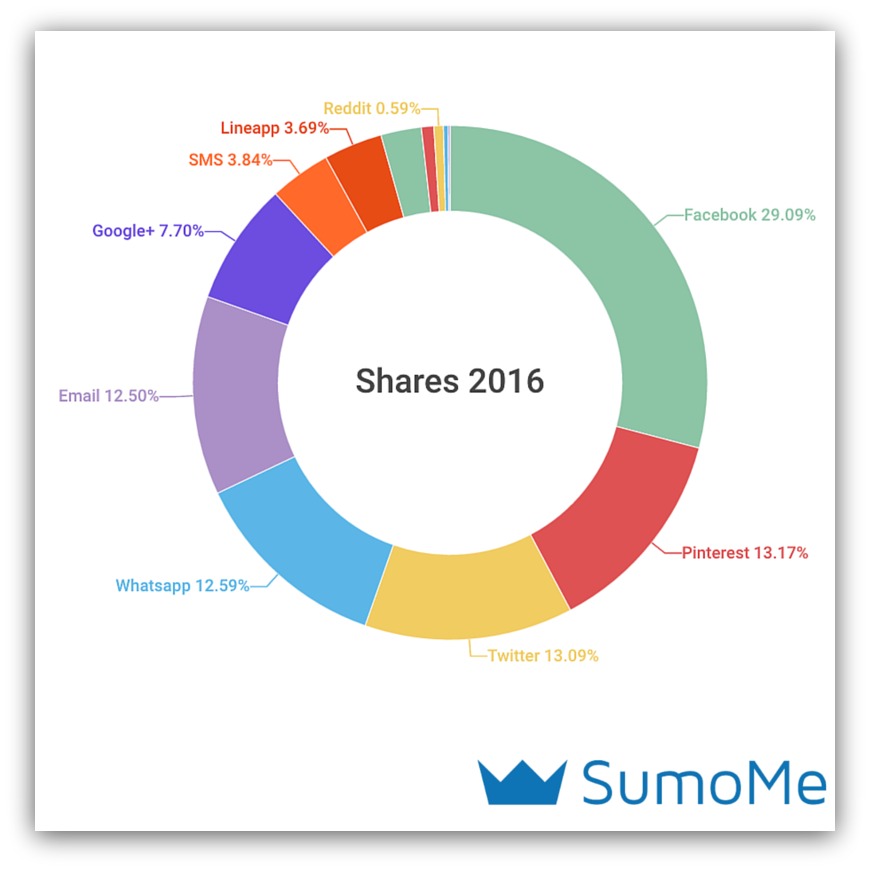
Not Pictured (Under 1.5%): LinkedIn, Reddit, Stumbleupon, Buffer, Pocket
Facebook is still cruising along at a 29% clip, but now they’re legitimately doubling up the competition.
Twitter and email are shared to less while Whatsapp is shared to a bit more. But notice what’s different between 2015 and 2016.
The big fish get bigger and the small guys get smaller.
Everything from Lineapp-on was shared to a bit more, while everything below Lineapp was shared to less. There’s a line in the sand starting to form, and the bigger, more established sharing platforms are benefiting.
Let’s also notice what stayed the same between 2015 and 2016:
Facebook is eternal: It’s safe to say the majority of your shares will happen on Mark Zuckerberg’s watch. Facebook consistently hovers at almost 30% of shares. It’s a solid platform to expect shares from.
Nothing else is above 15%: On the flip side, anyone banking on shares from a platform not named Facebook might need to rethink their strategy. The average social share to every other medium is so low that you shouldn’t hope to dominate one of these areas.
LinkedIn and Reddit lag significantly: These are big names that perform way below other mediums. Though Reddit is a “share from” site more than a “share to.” LinkedIn, on the other hand, should be a “share to” site. I won’t speculate, but it seems low for such a professional-focused site.
Most people would see these stats and say, “Alright, I’m good. Got the gist. Time to go watch some Netflix.”
But they’d be missing out. Big time.
See, what I just showed you were overall share stats. You can get a good idea of the state of shares from those graphs. They’ll tell you what’s happening in general. But you’d be missing out on the more important story.
I’m talking about the difference between mobile shares and desktop shares.
The sharing behaviors between the two devices are very, very different. Except Facebook. Facebook is life.
And, just like the last graphs, there was a shift in trends from 2015 to 2016 in shares. This is the information that’ll help you win in the rest of 2016.
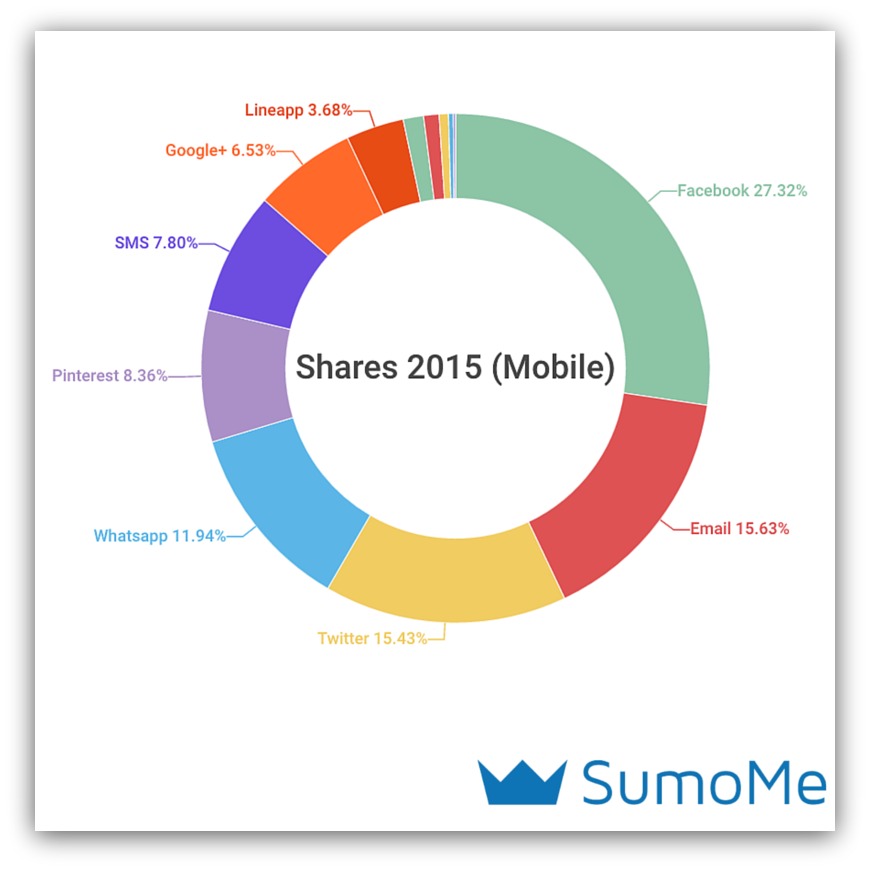
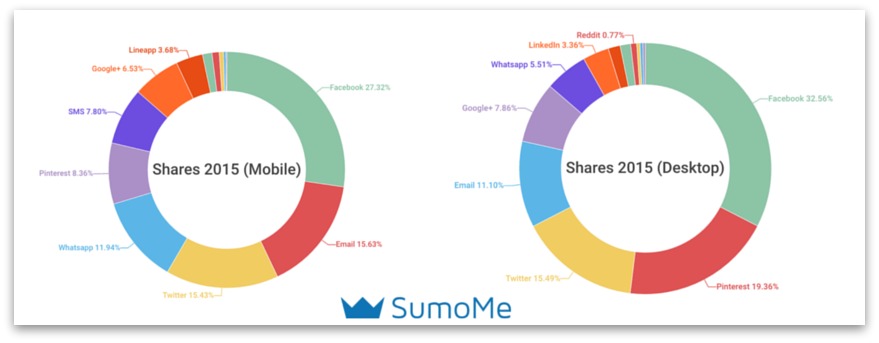
Not Pictured (Under 1.5%): LinkedIn, Reddit, Stumbleupon, Buffer, Pocket
One big trend to consider from 2015 was the the consistency of mediums over 15%. Facebook, email AND Twitter were all over the 15% share mark, with Whatsapp close behind at almost 12%.
The other, quite possibly bigger, finding was how little Pinterest is shared from mobile. The average for all devices in 2015 was a 13% share rate, yet from mobile the rate is 8%.
We’ve seen half percent movements between the years, so a 5% decrease is significant enough to declare that Pinterest isn’t as shared on mobile.
But the big jump comes when you look at 2016 mobile share trends.
The biggest change...well, it’ll be obvious:
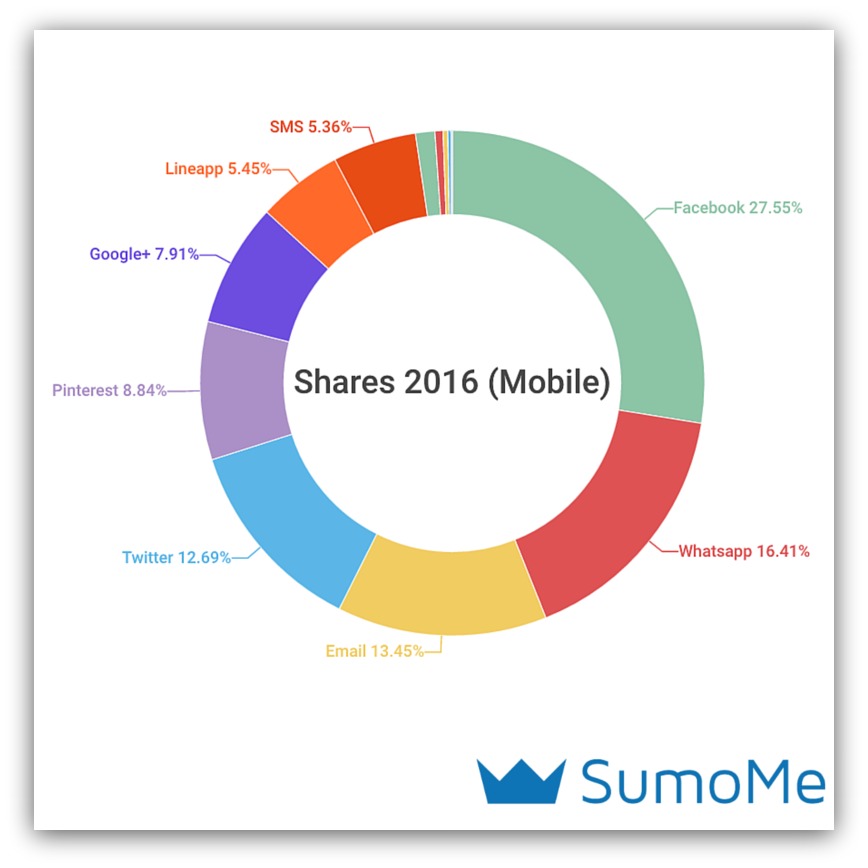
Not Pictured (Under 1.5%): LinkedIn, Reddit, Stumbleupon, Buffer, Pocket
What’s up, Whatsapp?! That’s a 4% increase from 2015, vaulting it all the way to the second-most shared medium (behind Facebook). It overtook email and Twitter in that time.
Everything else shifts down the ladder with the exception of Twitter. Readers shared 3% less to Twitter in 2016, and that share can be attributed to the rise in Whatsapp.
The main findings you can take away from mobile sharing trends?
Facebook still dominates: Also, the sun is hot, grass is green and 1 + 1 = 2. Let’s move on.
Whatsapp is a mobile monster: Whatsapp rises from the fourth-most shared-to medium to the second-most. Perhaps this signals a growing user base to tap into.
People don’t share to Pinterest from mobile: Sharing to Pinterest drops dramatically on mobile. They lose as much as Whatsapp gains.
Looking at mobile sharing trends vs. aggregate sharing trends provides a great look into how mobile sharing influences the entire picture.
But we can get more granular than that. As they probably said in Inception, “We need to go deeper and learn about marketing.”
So let’s look at the other half of the equation: desktop sharing trends.
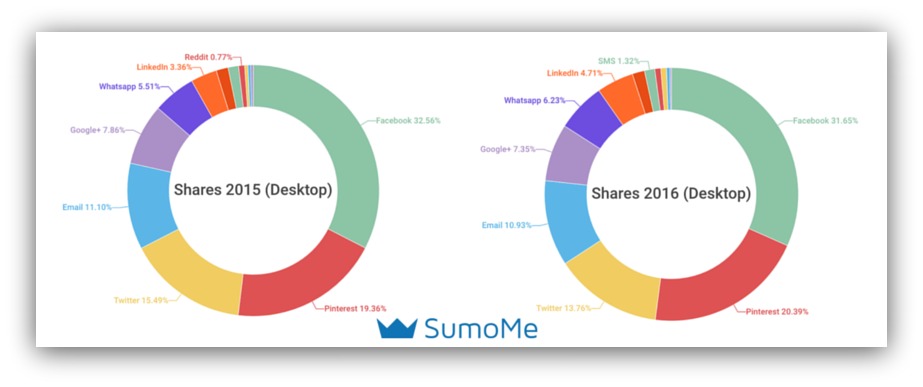
So it seems like we hurt Pinterest’s feelings, because they up and decided to dominate the desktop:
Not Pictured (Under 1.5%): Lineapp, SMS, Reddit, Stumbleupon, Buffer, Pocket
Look at how Pinterest soared up to the second most-shared-to medium! Check out the side-by-side comparisons of desktop vs mobile in 2015:
Pinterest more than doubles their shares from mobile to desktop (8.36% to 19.36%). Whatever it is about Pinterest, people like to share there from their desktops.
Some other things you’ll notice:
Facebook dominance increases: Facebook continues to be a stalwart, this time capturing 32% of share traffic on desktops.
Less shares to email: Although readers are on their desktops, they feel less compelled to share to email (only by 4%, but it’s still a drop).
Mobile-centric shares drop off: Mobile-based sharing mediums like Whatsapp, Lineapp and SMS take obvious big hits when moving to desktop.
These same trends hold true when comparing 2016 desktop vs mobile shares. So we don’t need to compare those.
But it’s the changes from 2015 to 2016 in desktop shares that reveal what you should be focusing on the rest of the year.
With the exception of Pinterest, the readers are turning in a “Robin Hood Effect” in 2016:
The top players (Facebook, Twitter, Email and Google+) see their shares dip almost 1% each, while the bottom players (Whatsapp, LinkedIn, etc.) benefit by raising their shares. Otherwise, everything else holds firm.
So what are the big takeaways from all this data? What can you do with all this data from the guide?
A couple things, actually. And acting on these pieces of information will help your content get shared like never before.
Stats are great. But if you don’t do anything with them then what’s the point?
So I won’t leave you to guess.
Instead, I’ll give you four easy-to-follow social share best practices that’ll help you get more shares on your next piece of content.
This should be the most obvious best practice of them all.
There’s an obvious shift in behavior between desktop and mobile sharing. Pinterest is shared to far more on desktop while Whatsapp, Lineapp and SMS see significant dips in shares.
So why would you offer those options to the wrong audiences?
You don’t have to. All you have to do is set up your share bar to present different options to mobile and desktop visitors.
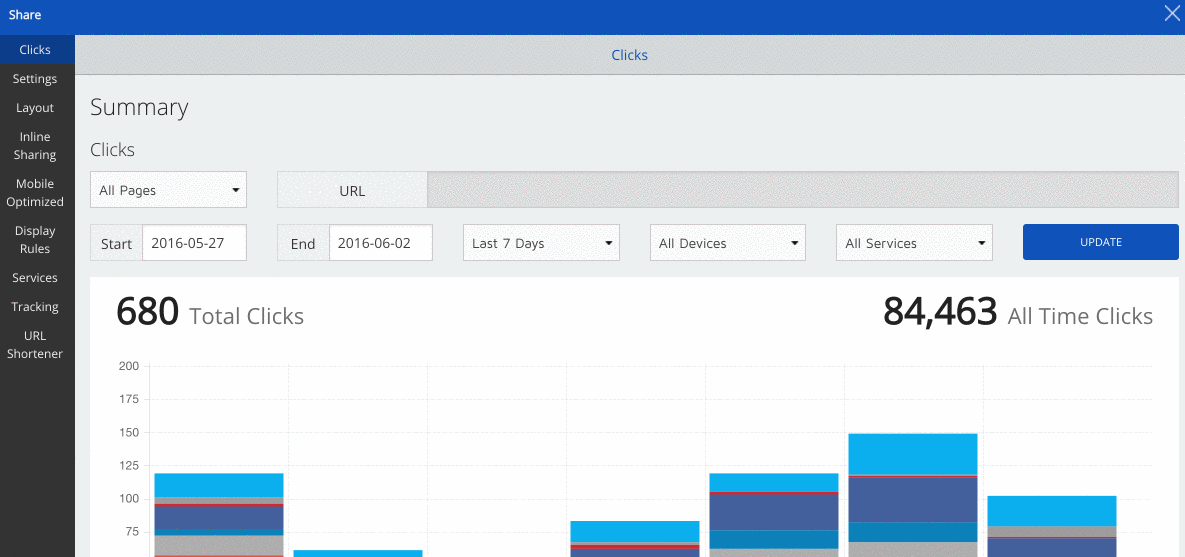
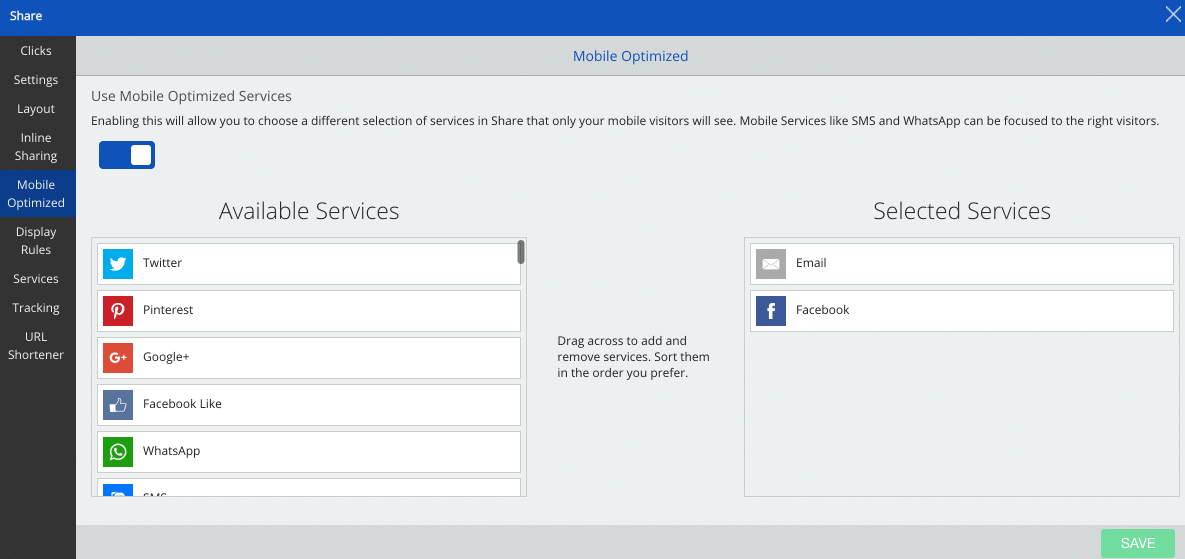
Here’s how you easily do that within Share:
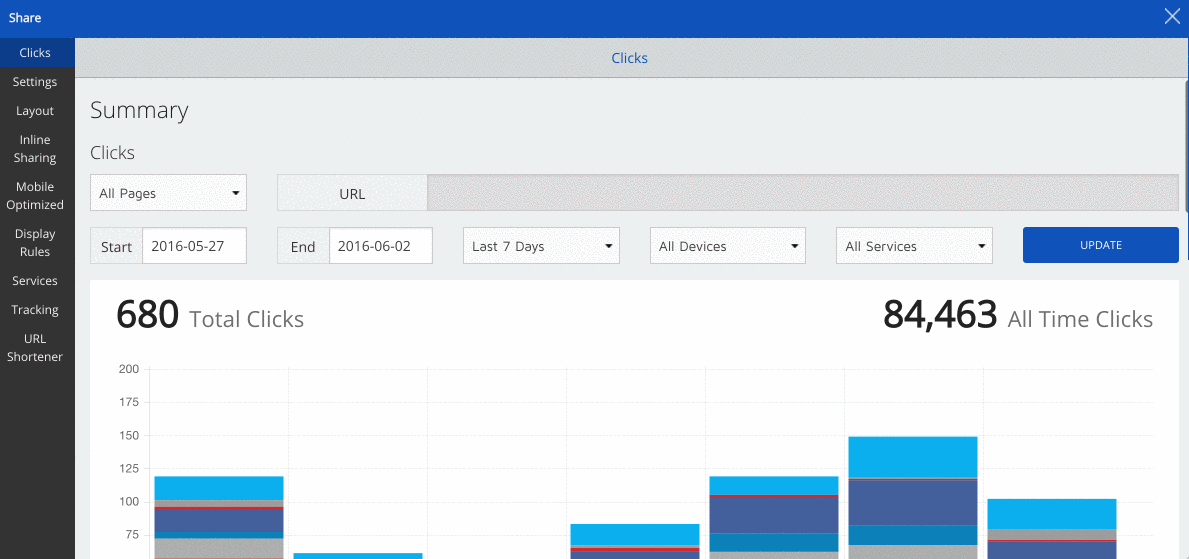
All it takes is a click of a button. Enabling mobile optimized services means your mobile visitors will see different options than they would on their desktop.
You can even customize where Share appears on mobile:
The share bar shows up at the bottom of the device, but in this example I move the bar to the top of the phone. You can adjust according to your mobile experience, though most users set Share for the bottom of the phone.
Once you’ve got your mobile sharing turned on, you’ll want to move on to the next best practice...
You’ve got an advantage over other marketers because you know where people share to the most.
That’s why you should control where your content is shared to.
If we go by the stats, here’s how your bar should break down:
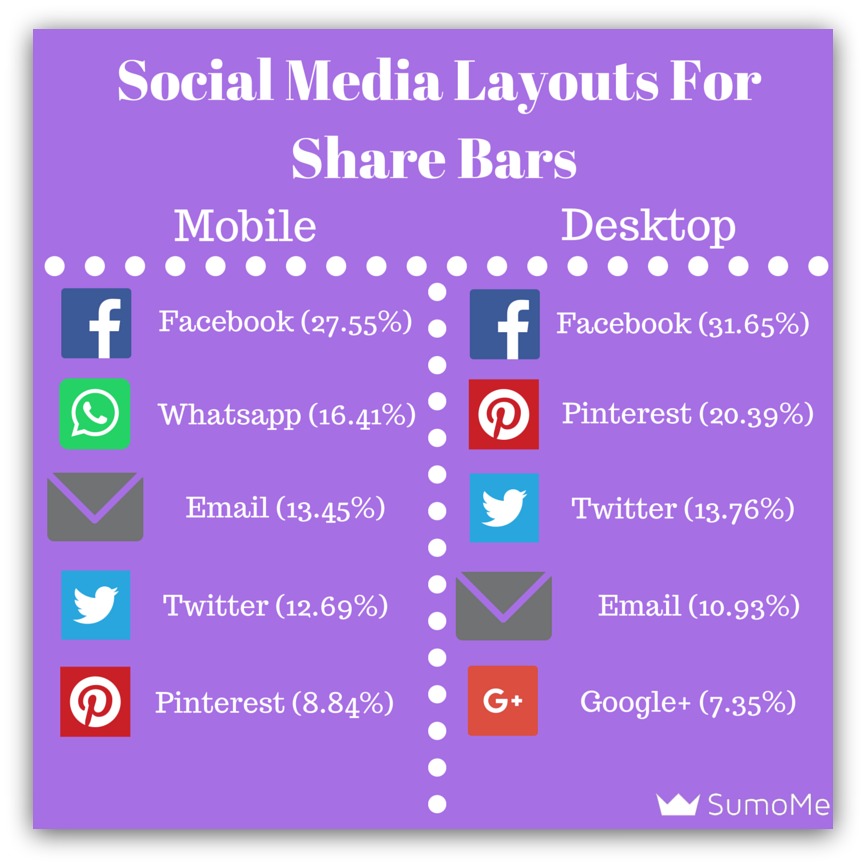
We recommend not going over five share icons per bar. Any more than that and it becomes too distracting.
The problem is, some share bars come pre-made and you can’t choose what social mediums you offer.
That sucks. Don’t use those. You want total control over what you present to your readers.
With Share, you can drag and drop the icons you want directly into your share bar:
Drag and drop the order to match the desktop and mobile sharing suggestions from the previous image. Those are statistically the mediums that receive the highest shares on these devices.
(Hint: There’s always a “More” option where readers can share to their preferred social medium.)
With your mobile and desktop share options optimized, you’re ready to move to step three.
Remember, this is in terms of best times to increase shares. If you’ve got a publishing cadence that works and brings in traffic, stick to that.
But if you’re already publishing earlier in the week, or you don’t have a publishing routine, consider this graph again:
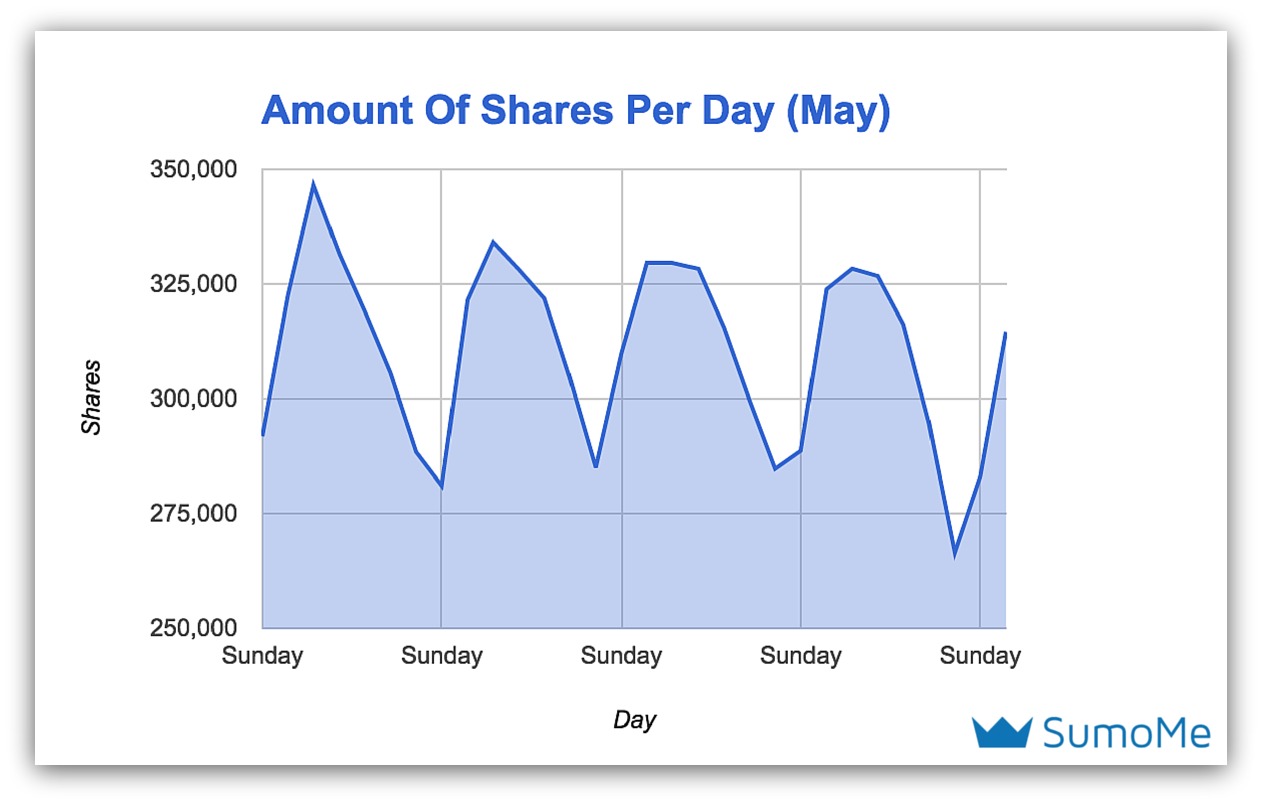
Monday-Wednesday are when the most shares occur, followed by a steep decline into the weekend.
If you need help driving traffic, check out these guides:
10 Ways to Drive More Traffic From Twitter: Twitter can be a powerful way to get your content in front of a massive built-in audience. These are the 10 best ways to promote your content there.
Drive Massive Traffic From Facebook (For Free): Get ready for the only 10,000 words you’ll ever need to read for driving traffic from Facebook.
Growth Hacking Reddit - 10K+ Visitors Each Month (For Free): Reddit is a go-to site for news for many people. This guide shows you how to leverage that traffic and redirect it to your content.
130 Ways to Get More Traffic: THIS is the biggest list on the web for driving any and all traffic to your content. Use with caution.
Pinterest is consistently one of the top five most-shared to mediums.
Facebook posts with images see 2.3X more engagement than those without images.
Get the picture (see what I did there)? High-quality images are vital now more than ever for sharing purposes.
Canva actually credits a large amount of their shares to their stunning images. Look at their traffic climb on Pinterest once they focused on using top-notch imagery:
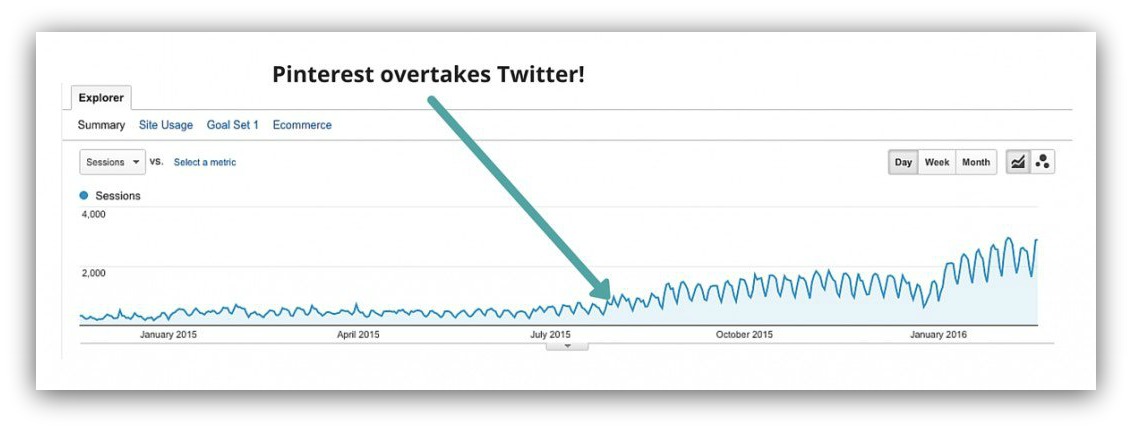
From Canva
Your content needs great imagery. If you don’t have an in-house or freelance designer at your disposal, you can take matters into your own hands one of two ways.
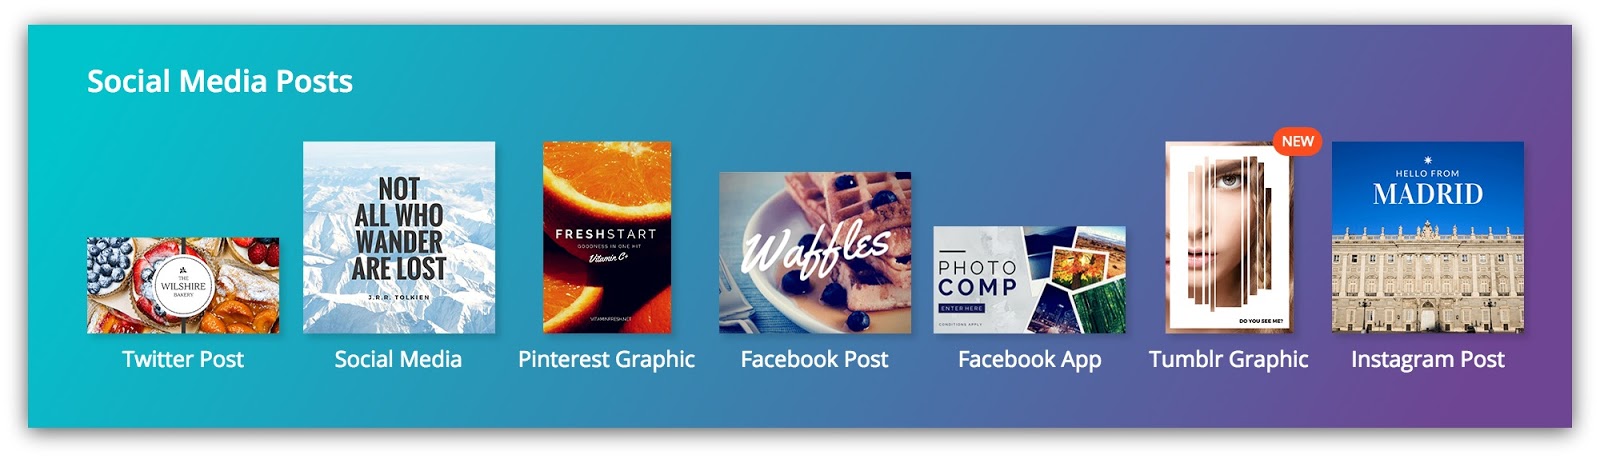
Canva makes it easy for anyone to create images. And I mean anyone, seeing as I suck at design and I was still able to make all the images for this guide in Canva.
A lot of the design is drag and drop, and they even provide pre-made layouts that you can customize:
You don’t even have to worry about sizing your image correctly for social media. They take care of that before you even begin:
All I’m sayin’ is it’s really easy to use. However, if you don’t trust your design skills even one iota, you can try the next option.
Fiverr is the cheapest way to get a high-quality image. Just like the name suggests, you can pay $5 (sometimes more) and get a professional designer to create a blog image.
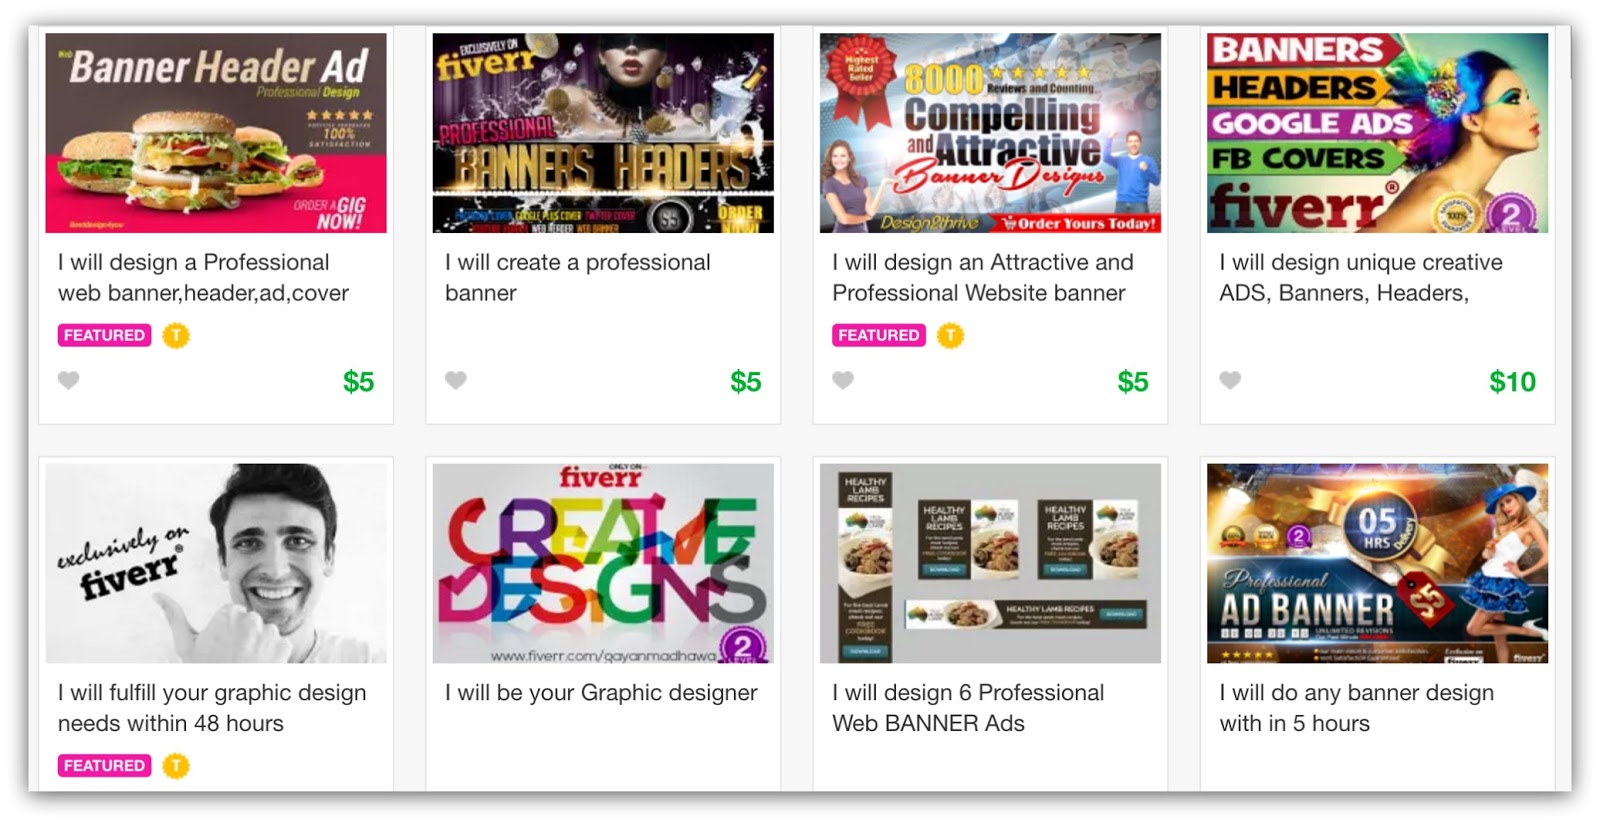
Depending on who you contract with, you can get an image back 24 hours or sooner. Most people work quick on Fiverr because...well...they’re only getting $5 a pop.
No matter which option you go with, make sure using a high-quality image is part of your content marketing plan.
You should have a solid plan for getting more social shares at this point in the guide. We’ve gone over when to post content for maximum shares, the difference between mobile and desktop and where people share the most.
But the 13 places to share to in this guide were only the biggest names or most shared-to. There are over 60 other places people share to, but I didn’t want to bore you in the post by listing them all.
If you’re curious, you can download the entire spreadsheet below. You can see 2015 and 2016 results, the amount of shares to all 70+ mediums AND break it down by mobile and desktop.
It’s the spreadsheet I based this entire guide off of, and you can have it for free.
Comments